Rowing ergometers can be placed on sliders (slide ergometer) to give rowers an ‘on-water’ feel.
In this case the machines, not the rower’s body, move back and forth. Due to this, a lighter mass (ergometer) needs to be accelerated (compared to the body mass of a rower) which brings the authors (Holsgaard-Larsen and Jensen, 2010) to a hypothesis that the reduced physiological cost would occur on slide ergometer performance compared to fixed ergometer performance.
Seven elite female rowers participated in the study. Each rower performed a trial on fixed and slide ergometer, having 48 hours between the tests. The protocol was ~60 minutes long, consisting of a 5 min warm-up, 3 sub-maximal 6 min tests and a maximal all-out 6 min test.
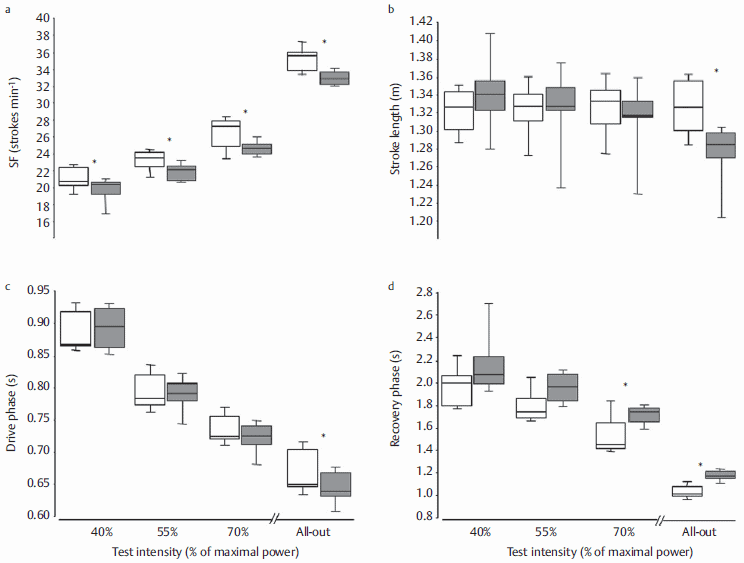
The results show that biomechanical variables differ between the two machines – max and mean forces generated on slide ergometer are lower and stroke frequency higher than on fixed ergometer. However, external power, heart rate, VO2 and respiratory exchange ratio value remain similar while maximal oxygen deficit is higher on slide ergometer during all-out test.
What to learn from this?
Slide ergometer could be used as a training tool, as it is as demanding as fixed ergometer in aerobic energy sources and probably even more demanding in anaerobic sources.
| Table. Power, heart rate, mean VO2, R-value, gross economy, and oxygen deficit. | ||||||||
| Median (range) |
40 % | 55 % | 70 % | All-out | ||||
| Slide | Stationary | Slide | Stationary | Slide | Stationary | Slide | Stationary | |
| power (w) | 128.0 | 122.9 | 173.3 | 167.8 | 213.4 | 213.0 | 305.1 | 295.0 |
| (41.7) | (42.8) | (50.8) | (49.5) | (64.8) | (63.9) | (85.0) | (91.1) | |
| heart rate (beats·min−1) | 134 | 133 | 155 | 148 | 167 | 168 | 184 | 181 |
| (38) | (19) | (27) | (26) | (27) | (26) | (13) | (14) | |
| VO2 (l·min−1) | 2.23 | 2.06 | 2.91 | 2.69 | 3.54 | 3.46 | 4.35 | 4.46 |
| (0.60) | (0.64) | (0.69) | (0.74) | (0.85) | (0.90) | (1.16) | (1.21) | |
| R-value (CO2/ O2) | 0.88 | 0.86 | 0.90 | 0.90 | 0.93 | 0.93 | 1.08 | 1.06 |
| (0.08) | (0.10) | (0.07) | (0.08) | (0.09) | (0.10) | (0.10) | (0.14) | |
| economy (%) | 18.2 | 19.0 * | 18.9 | 19.4 * | 19.5 | 19.6 | ||
| (1.3) | (2.1) | (1.5) | (1.1) | (2.0) | (1.3) | |||
| oxygen deficit (ml·O2·kg−1·min−1) | 51.0 | 39.0 * | ||||||
| (71) | (27) | |||||||
| Data are averaged from all rowing strokes between 180 – 300s of the test. Values are expressed as median and range (in parenthesis). * significant statistical difference between stationary and slide ergometer. Holsgaard-Larsen and Jensen (2010). | ||||||||
Source
Holsgaard-Larsen A, Jensen K. Ergometer Rowing With and Without Slides. International Journal of Sports Medicine 2010; DOI http://dx.doi.org/ 10.1055/s-0030-1265148.