How to analyze intensity zones at high intensity intervals
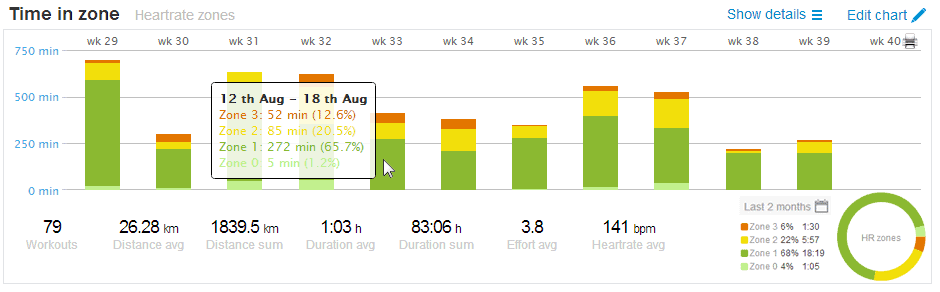
Athletes usually monitor their training intensity according to some intensity model. Probably the most frequently used method is so called time in zone approach. During this approach each heart beat is recorded and saved to appropriate intensity zone. This makes the whole intensity distribution analyzed very easily, just download the heart rate monitor data to appropriate software and at all time points there is the clear overview of the zone distributions. In most cases, especially during the long and steady-state workouts the time in zone approach works very well (Figure 1).
However, this method has been found to be poorly correlated to blood lactate measurements and session RPE method (Seiler & Kjerland, 2006), especially during the high intensity workouts. Averaging heart rate over an entire session may underestimate the energetic and sympathetic stress of repeated high intensity boats. Also, those interval sessions include warm-up and cool-down that inflate the time spent in the lowest intensity zone. During the recovery periods between the intervals there is also a deviation from the intensity and the corresponding heart rate, as it takes some time for heart rate to recover to reflect the actual intensity during recoveries between the intervals. Moreover, the accumulating fatigue also slows the heart rate recovery down. Therefore, the time in zone method will lead to the deviation of the true intensities used during the workouts (Figure 2).
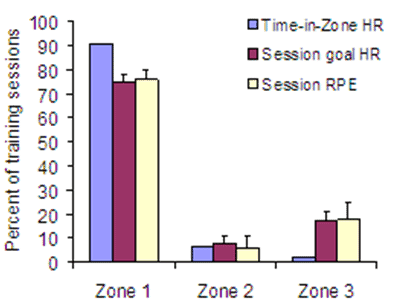
If, for example, coaches and athletes use time in zone method during the high intensity training period the accumulation of training time to lower intensity zones may lead to the misinterpretation of the actual intensities used during the training process. As the recorded time in Zone 3 also decreases using this method (Figure 2, blue bars), there may be a temptation to further increase the amount of interval trainings. This may lead to quick fatigue accumulation and the decrease in performance as the balance between low and high intensity trainings will be disturbed too much.
Therefore, it may be suggested that during the high intensity trainings the appropriate zone should be recorded as the zone according to the maximum heart rate during each interval quantified by the interval length. For example, 3 x 5 min at 100% VO2max will result in 3 x 5 min in Zone 3 and the rest (recovery intervals, warm-up, cool-down) will be recorded into Zone 1.
References